Why Use SEM-EDS for Mineral Identification
Determining mineral phases within a sample is essential for geologists, mining engineers, and materials scientists. Traditional techniques like X-ray diffraction (XRD) yield bulk compositional data but lack spatial resolution. Optical microscopy, while providing structural context, is resolution-limited and relies heavily on subjective interpretation. Scanning electron microscopy (SEM), especially when paired with energy dispersive X-ray spectroscopy (EDS), bridges this gap.
SEM-EDS allows researchers to visualize mineral textures at the sub-micron scale and identify their elemental compositions in situ. The result is a detailed mineralogical map that illustrates not just which phases are present, but how they are distributed, associated, and intergrown.
High-Resolution Imaging of Minerals
Visualizing Microstructures
SEM produces detailed images that expose fine features invisible to optical microscopes. Sub-micron inclusions, exsolution textures, and microfractures within mineral grains are readily observable. For instance, SEM can reveal tiny sulfide inclusions within silicates or oxide intergrowths in feldspar, which help reconstruct thermal and deformation histories.
Texture and Grain Morphology
Grain size, shape, and contact relationships are critical in interpreting rock genesis. SEM distinguishes whether grains are interlocking, fractured, euhedral, or rounded. These observations guide interpretations of crystallization rate, deformation, or alteration processes.
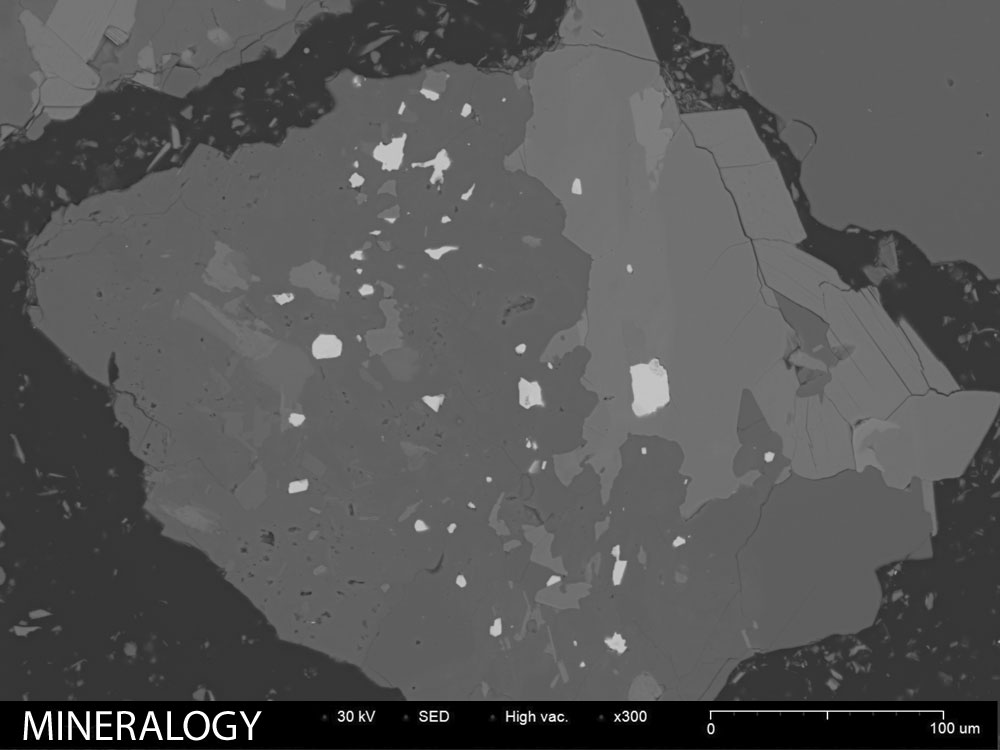
Backscattered Electron (BSE) Imaging
BSE mode exploits atomic number contrast: minerals with heavier elements appear brighter. This creates natural contrast in polished thin sections, highlighting compositional differences without staining. For example, a bright galena grain stands out in a quartz matrix, allowing rapid location and subsequent EDS analysis.
Elemental Analysis for Phase Identification
Definitive Mineral Fingerprints
EDS provides real-time elemental spectra from selected points or areas. These elemental “fingerprints” enable precise mineral identification. For example, an unknown grain showing chromium and iron peaks likely indicates chromite; distinguishing barite (Ba) from celestite (Sr) becomes straightforward.
Even visually similar minerals—like quartz and calcite or polymorphs of aluminosilicates—are easily separated based on their elemental makeup. This removes ambiguity and provides high-confidence identification where optical methods fall short.
Detecting Rare or Minor Phases
SEM-EDS is particularly effective in detecting low-abundance minerals. X-ray maps or targeted spot analyses can identify rare earth minerals or trace inclusions crucial to ore valuation or quality control. Such insights are often missed by bulk analytical methods.
Quantitative Phase Analysis and Mapping
Modal Mineralogy by EDS Mapping
Automated SEM-EDS systems can perform thousands of micro-analyses across a sample to quantify modal mineralogy. This yields phase proportions, such as “35% quartz, 28% feldspar, 20% mica, 17% magnetite.” Such quantitative outputs support exploration strategies, ore characterization, or materials development.
Mineral Liberation Analysis
In mineral processing, understanding how ore minerals are distributed and liberated from the gangue is key to optimizing recovery. SEM-based particle analysis determines:
- What percentage of a mineral (e.g., chalcopyrite) is free vs. locked in composite particles.
- Which gangue minerals are associated with valuable phases.
- The textural context of mineral contacts, guiding grind size and separation strategy.
Efficiency and Accessibility
Fast, Real-Time Analysis
SEM-EDS enables same-day analysis on polished sections or grain mounts. In exploration or production environments, rapid feedback is critical. For example, drill core samples analyzed overnight can inform next-day field decisions.
Compact, On-Site Capability
Tabletop SEM systems, such as those from NanoImages with Bruker XFlash® EDS, bring advanced mineral analysis to compact labs. These units offer high-resolution imaging and EDS mapping capabilities in a desktop footprint—ideal for mine sites, academic departments, or R&D centers.
Automated, User-Friendly Software
Modern SEM software simplifies the mineral analysis process:
- Built-in mineral databases match EDS spectra to known phases.
- Automated phase recognition maps and quantifies each mineral.
- Grain size distributions, association statistics, and phase percentages are reported without extensive user interpretation.
This reduces dependency on specialist users, enabling geologists and lab technicians to confidently obtain actionable data.
SEM as a Pillar of Mineral Analysis
SEM-based phase analysis transforms how mineral samples are understood. High-resolution imaging clarifies textures and structures, while EDS confirms chemical identity with precision. Even elusive or trace minerals are identified and quantified.
Across geoscience, mining, ceramics, and metallurgy, SEM-EDS has become essential. Its ability to deliver detailed, context-rich mineral data supports smarter exploration, optimized processing, and accelerated materials development. And with powerful tabletop systems now available, these capabilities are more accessible than ever—bringing world-class mineral analysis directly to where it’s needed most.