Correlative Microscopy · Microplastics
Earlier this year, a study in Nature Medicine delivered a headline that was hard to shake: human brain tissue collected in 2024 contained measurably more plastic than tissue collected just eight years earlier — on the order of a 50% increase, with concentrations far higher in the brain than in the liver or kidney. The figure that traveled fastest was that the accumulated nanoplastic in a brain amounted to roughly a plastic spoon’s worth.
Microplastics, it turns out, cross the blood-brain barrier. And they appear to be piling up over time, tracking the rise of plastic in the environment around us. It is a genuinely alarming finding. But underneath the headline sits a quieter, more technical question that determines whether any of these numbers mean anything at all:
How do you actually know that particle is plastic?
That question is the real frontier of microplastics research — and it happens to be one that no single instrument can answer alone.
The counting problem
For years, a large share of microplastics studies relied on visual inspection: a researcher looks through an optical microscope, sees a small colored fragment or fiber, and counts it as plastic. The trouble is that the natural world is full of small particles that look exactly like plastic but aren’t — chitin from insect and crustacean fragments, lignin and cellulose from plant matter, mineral grains, salt crystals, and biological debris. Under a light microscope, a degraded cellulose fiber and a polyester fiber can be indistinguishable.
The result is a field plagued by false positives, and the magnitude is not subtle. When researchers have stress-tested automated detection methods, fully automated identification of particles on a filter produced false-positive rates as high as 80%. In another comparison, two widely used detection approaches applied to the same samples disagreed by more than 400%. When the published counts of a phenomenon can differ by a factor of four or five depending on who is doing the counting and how, the science does not yet have a reliable foundation — and policy built on that science is building on sand.
This is the problem that decides whether the brain study, and the hundreds like it, hold up. It is also a problem with a known solution.
Three questions, three instruments
Identifying a microplastic particle with confidence means answering three separate questions, and each one calls for a different physical measurement.
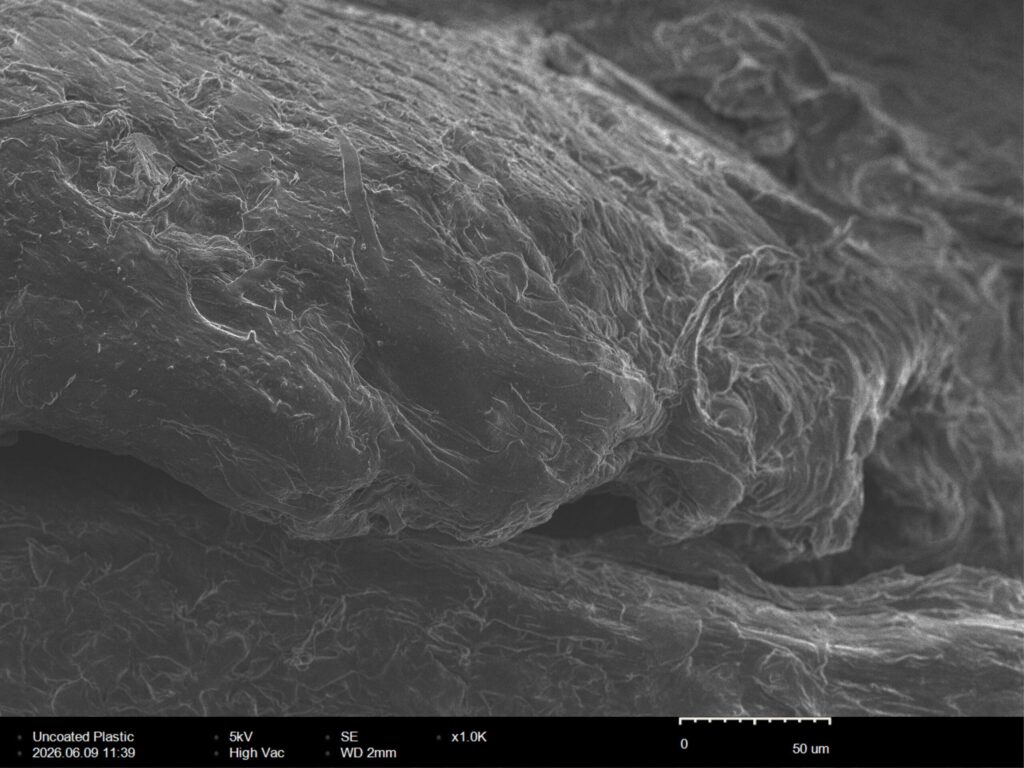
What does it look like? Electron microscopy answers the first question. A scanning electron microscope resolves the particle’s morphology far beyond what light can show — whether it is a fiber, a film flake, or a sphere, and what its surface texture and edges look like. Shape is the first clue to origin: a fiber points toward textiles, a film fragment toward packaging, a microsphere toward cosmetics or industrial abrasives. Morphology alone does not prove a particle is plastic, but it sizes and characterizes every candidate and separates the population into forms worth investigating.
What is it made of, elementally? This is where most optical-only studies fall down, and where energy-dispersive X-ray spectroscopy earns its place. EDS reads the elemental composition of the same particle the SEM just imaged. Polymers are built from carbon, hydrogen, and oxygen; a particle whose spectrum is dominated by carbon with no significant mineral signature stays on the list as a polymer candidate. A particle that lights up with silicon, calcium, aluminum, or sodium does not — it is silica, a carbonate, an aluminosilicate, or a salt, and it can be removed from the count. This single screening step eliminates a large share of the false positives that inflate visual-inspection studies. Notably, the Nature Medicine brain study used exactly this combination — SEM with EDS — to confirm that its particulates were not metallic or mineral, and to verify that the brain particles were largely nanoscale shard-like fragments.
What polymer is it, specifically? Elemental data narrows the field to “carbon-based,” but it cannot tell polyethylene from polypropylene from polystyrene — they share essentially the same elemental makeup. Answering the final question requires molecular information, and that is what Raman spectroscopy provides. A Raman spectrum is a vibrational fingerprint of molecular bonds, and it distinguishes specific polymers from one another with a specificity neither imaging nor elemental analysis can reach. You cannot reach a statement like “this is a polyethylene fragment of this size and shape” from imaging or elemental data alone; it requires molecular spectroscopy.
Why “the same stage” matters
The three measurements are individually valuable. Performed on the same particle, at the same coordinates, they become something much stronger: a closed chain of evidence.
Consider the alternative. Image a particle on the SEM, then move the sample to a separate Raman bench, and the BSE contrast that told you which particle to interrogate is gone — you are hunting for a sub-10-micron target on a filter by eye, hoping you have found the same one. By the time you have re-registered position across instruments, you may have lost hours, or the particle. Every transfer between instruments introduces the risk that the morphology, the chemistry, and the molecular identity you so carefully measured belong to three different objects.
Performed on the same particle the SEM imaged and the EDS screened, Raman closes the chain. Morphology, composition, and molecular identity all point to the same conclusion, on the same object, at the same coordinates on the stage. That is what turns “we found particles” into “we identified polyethylene nanoplastics of this size and shape distribution” — the difference between a headline and a defensible result.
From the headline to the bench
The microplastics-in-the-brain story is compelling precisely because the methodology behind it was careful. But that rigor has, until recently, lived mostly in well-funded research centers with floor-standing instruments and specialized staff. The open opportunity now is access: bringing a correlative SEM + EDS + Raman capability into the broader population of environmental, toxicology, and university labs that are standing up microplastics programs and confronting the false-positive problem for the first time.
A benchtop platform that integrates electron imaging, elemental analysis, and Raman identification on a single stage puts the full forensic chain — find it, screen it, name it — within reach of labs that could never justify a multi-instrument suite. As microplastics move from environmental curiosity to human-health priority, the labs that answer “is that particle really plastic?” credibly — and on every particle — are the ones whose data will hold up.
At NanoImages, building correlative SEM, EDS, and Raman into a single benchtop analytical platform is exactly the problem we work on. If your lab is moving into microplastics characterization, we’re glad to talk through what a correlative workflow looks like in practice.
Jon Lechich, Founder — NanoImages
Sources
- Nihart et al., “Bioaccumulation of microplastics in decedent human brains,” Nature Medicine 31, 1114–1119 (2025). https://doi.org/10.1038/s41591-024-03453-1
- University of New Mexico Health Sciences Newsroom, on the brain microplastics study. https://hscnews.unm.edu/news/hsc-newsroom-post-microplastics-human-brains
- Araujo et al., review on Raman identification of microplastics, Water Research (2018). sciencedirect.com/science/article/abs/pii/S0043135418304421
- Comparison of manual, semi-automated, and automated FTIR/Raman methods, Marine Pollution Bulletin (2021). sciencedirect.com/science/article/abs/pii/S0025326X21011358
- Fluorescence microscopy vs. Raman detection discrepancy study, Spectroscopy (2025). spectroscopyonline.com/view/evaluating-microplastic-detection-with-fluorescence-microscopy-and-raman-spectroscopy